Box Plots and Quartiles - GCSE Higher Maths
This video is for students aged 14+ studying GCSE Maths. A video explaining how to draw and interpret box plots. This includes how to calculate the upper an...
1st Class Maths
237.0K views • Nov 17, 2023
About this video
This video is for students aged 14+ studying GCSE Maths.
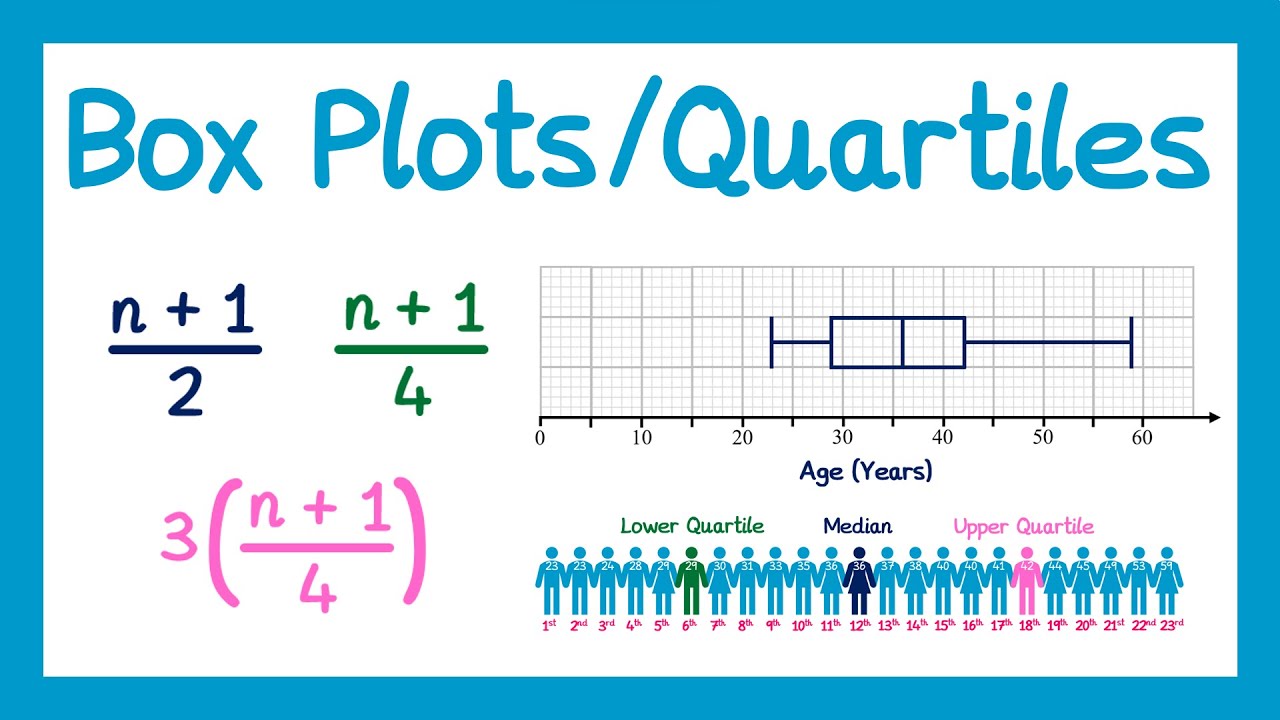
A video explaining how to draw and interpret box plots. This includes how to calculate the upper and lower quartiles and the interquartile range. This is for the GCSE higher course.
Exam Question Booklets:📝
🔗Exam Question Edexcel Style: https://www.1stclassmaths.com/_files/ugd/9f3fb0_cbbd180967df4f5f969ccb64847d6935.pdf
🔗Exam Questions AQA Style: https://www.1stclassmaths.com/_files/ugd/9f3fb0_4833e96ffc8d4314b17806d58149e2c9.pdf
🌐 https://www.1stclassmaths.com/ for more high quality revision questions.
0:00 Introduction
0:10 Locating the median value
2:48 Locating the lower quartile and upper quartile
4:00 Example - Finding the median, quartiles and interquartile range from a list of data
6:09 How to draw a box plot
7:19 Interpreting a box plot
10:30 Comparing distributions from box plots
13:53 Drawing a box plot from a cumulative frequency diagram
To help my channel:
❤️Like
💬Comment
🔔Subscribe
Follow me on:
https://www.tiktok.com/@1stclassmaths
https://www.instagram.com/1stclassmaths/
https://twitter.com/1stclassmaths
🦋 https://bsky.app/profile/1stclassmaths.bsky.social
Tags and Topics
Browse our collection to discover more content in these categories.
Video Information
Views
237.0K
Likes
3.5K
Duration
16:00
Published
Nov 17, 2023
User Reviews
4.7
(47) Related Trending Topics
LIVE TRENDSRelated trending topics. Click any trend to explore more videos.
No specific trending topics match this video yet.
Explore All Trends