97 Master EDA & Data Visualization with ChatGPT: A Complete Guide 📊
Learn how to perform effective Exploratory Data Analysis (EDA) and create insightful visualizations using ChatGPT. Boost your data science skills today!
Engineering Academy Online
33 views • Jan 29, 2025
About this video
**Exploratory Data Analysis (EDA) and Visualization with ChatGPT**
Exploratory Data Analysis (EDA) is a crucial step in the data science workflow, helping analysts understand the structure, patterns, and relationships in a dataset before applying machine learning or statistical modeling. EDA involves summarizing key characteristics of the data, detecting anomalies, and uncovering insights through statistical summaries and visualizations.
With ChatGPT, EDA can be streamlined and made more intuitive by leveraging its ability to assist with:
- **Data Cleaning & Preprocessing:** Handling missing values, detecting outliers, and transforming data.
- **Descriptive Statistics:** Computing summary statistics like mean, median, variance, and correlation.
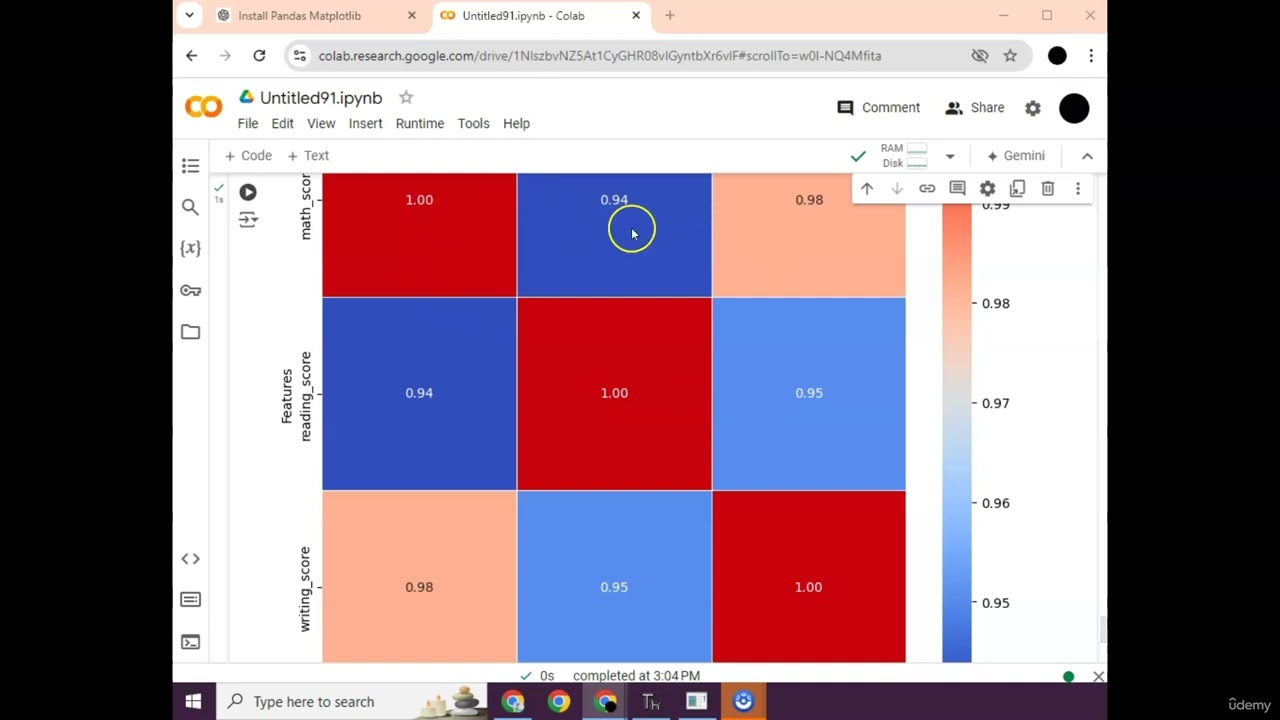
- **Visualization:** Generating insightful charts and plots (e.g., histograms, box plots, scatter plots) using Python libraries such as Matplotlib, Seaborn, and Plotly.
- **Pattern & Anomaly Detection:** Identifying trends, seasonality, clusters, and potential data issues.
- **Automated Report Generation:** Summarizing findings in natural language for better interpretability.
By integrating ChatGPT into the EDA process, users can automate repetitive tasks, gain deeper insights more efficiently, and make data-driven decisions with confidence.
Exploratory Data Analysis (EDA) is a crucial step in the data science workflow, helping analysts understand the structure, patterns, and relationships in a dataset before applying machine learning or statistical modeling. EDA involves summarizing key characteristics of the data, detecting anomalies, and uncovering insights through statistical summaries and visualizations.
With ChatGPT, EDA can be streamlined and made more intuitive by leveraging its ability to assist with:
- **Data Cleaning & Preprocessing:** Handling missing values, detecting outliers, and transforming data.
- **Descriptive Statistics:** Computing summary statistics like mean, median, variance, and correlation.
- **Visualization:** Generating insightful charts and plots (e.g., histograms, box plots, scatter plots) using Python libraries such as Matplotlib, Seaborn, and Plotly.
- **Pattern & Anomaly Detection:** Identifying trends, seasonality, clusters, and potential data issues.
- **Automated Report Generation:** Summarizing findings in natural language for better interpretability.
By integrating ChatGPT into the EDA process, users can automate repetitive tasks, gain deeper insights more efficiently, and make data-driven decisions with confidence.
Video Information
Views
33
Likes
1
Duration
7:23
Published
Jan 29, 2025
Related Trending Topics
LIVE TRENDSRelated trending topics. Click any trend to explore more videos.
No specific trending topics match this video yet.
Explore All Trends