4 Important Test Questions on Mean Median and Mode
Box-Whisker Plots Playlist: https://www.youtube.com/playlist?list=PLJ-ma5dJyAqrNQdDbyPsFjLGBe5YRIayL Cumulative Frequency Diagram from Group Data: https://ww...

Anil Kumar
3.1K views • Aug 14, 2019
About this video
Box-Whisker Plots Playlist: https://www.youtube.com/playlist?list=PLJ-ma5dJyAqrNQdDbyPsFjLGBe5YRIayL
Cumulative Frequency Diagram from Group Data: https://www.youtube.com/watch?v=Y-U2NlNSaks&list=PLJ-ma5dJyAqoyNvthGAx53QQ2jevRpoSP&index=21 Box and Whisker Plot: https://www.youtube.com/watch?v=egGyi9QJCQ4&list=PLJ-ma5dJyAqpldIsYj12SbqSpPDfyITE5&index=11
https://www.youtube.com/@MathematicsTutor
Learn From Anil Kumar: anil.anilkhandelwal@gmail.com
#quartile_boxandwhisker #interquartilerange #mean_median_mode_range #Ogive #BoxWhiskerPlot #CummulativeFrequency #standarddeviation_ib_gcse #groupdata #statistics_ib_gcse #edexcelmath #ibslmath #igcse_extended #gcse_extended #Igcse_0580 #LeafPlot #stemandleafplot
Quartile Interquartile range, semi-quartile range, outliers and data analysis from the box-and-whisker plots.
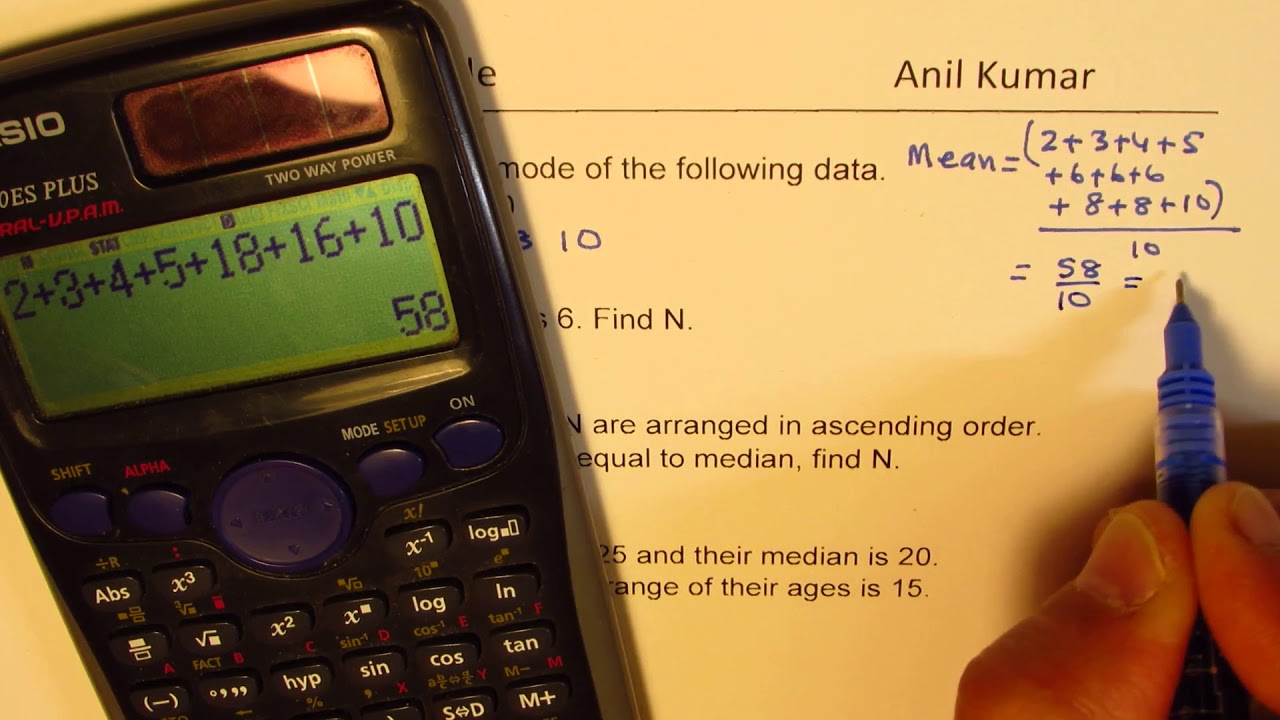
Q1. Find mean median and mode of the following data.
2, 4, 6, 3, 8, 6, 5, 8, 6, 10
Q2. Mean of 3, 7, 2, 8, and N is 6. Find N.
Q3. The numbers 2, 3, 6, 8 and N are arranged in ascending order.
If the mean of the number is equal to median, find N.
Q4. Mean age of three persons is 25 and their median is 20.
Find age of each person if the range of their ages is 15.
Cumulative Frequency Diagram from Group Data: https://www.youtube.com/watch?v=Y-U2NlNSaks&list=PLJ-ma5dJyAqoyNvthGAx53QQ2jevRpoSP&index=21 Box and Whisker Plot: https://www.youtube.com/watch?v=egGyi9QJCQ4&list=PLJ-ma5dJyAqpldIsYj12SbqSpPDfyITE5&index=11
https://www.youtube.com/@MathematicsTutor
Learn From Anil Kumar: anil.anilkhandelwal@gmail.com
#quartile_boxandwhisker #interquartilerange #mean_median_mode_range #Ogive #BoxWhiskerPlot #CummulativeFrequency #standarddeviation_ib_gcse #groupdata #statistics_ib_gcse #edexcelmath #ibslmath #igcse_extended #gcse_extended #Igcse_0580 #LeafPlot #stemandleafplot
Quartile Interquartile range, semi-quartile range, outliers and data analysis from the box-and-whisker plots.
Q1. Find mean median and mode of the following data.
2, 4, 6, 3, 8, 6, 5, 8, 6, 10
Q2. Mean of 3, 7, 2, 8, and N is 6. Find N.
Q3. The numbers 2, 3, 6, 8 and N are arranged in ascending order.
If the mean of the number is equal to median, find N.
Q4. Mean age of three persons is 25 and their median is 20.
Find age of each person if the range of their ages is 15.
Tags and Topics
Browse our collection to discover more content in these categories.
Video Information
Views
3.1K
Likes
49
Duration
8:57
Published
Aug 14, 2019
User Reviews
4.5
(3) Related Trending Topics
LIVE TRENDSRelated trending topics. Click any trend to explore more videos.
No specific trending topics match this video yet.
Explore All Trends