Graphing for RBTs | Trend/Level/Variability | ABA Line Graphs
RBT Exam Study Materials: https://rbtexamreview.com 00:00 ABA Graphs for RBTs 00:20 RBT Exam Study Materials 00:41 Components of a Line Graph (x-axis, y-axi...

ABA Exam Review - Behavior Tech & Behavior Analyst
69.3K views • Apr 11, 2021
About this video
RBT Exam Study Materials: https://rbtexamreview.com
00:00 ABA Graphs for RBTs
00:20 RBT Exam Study Materials
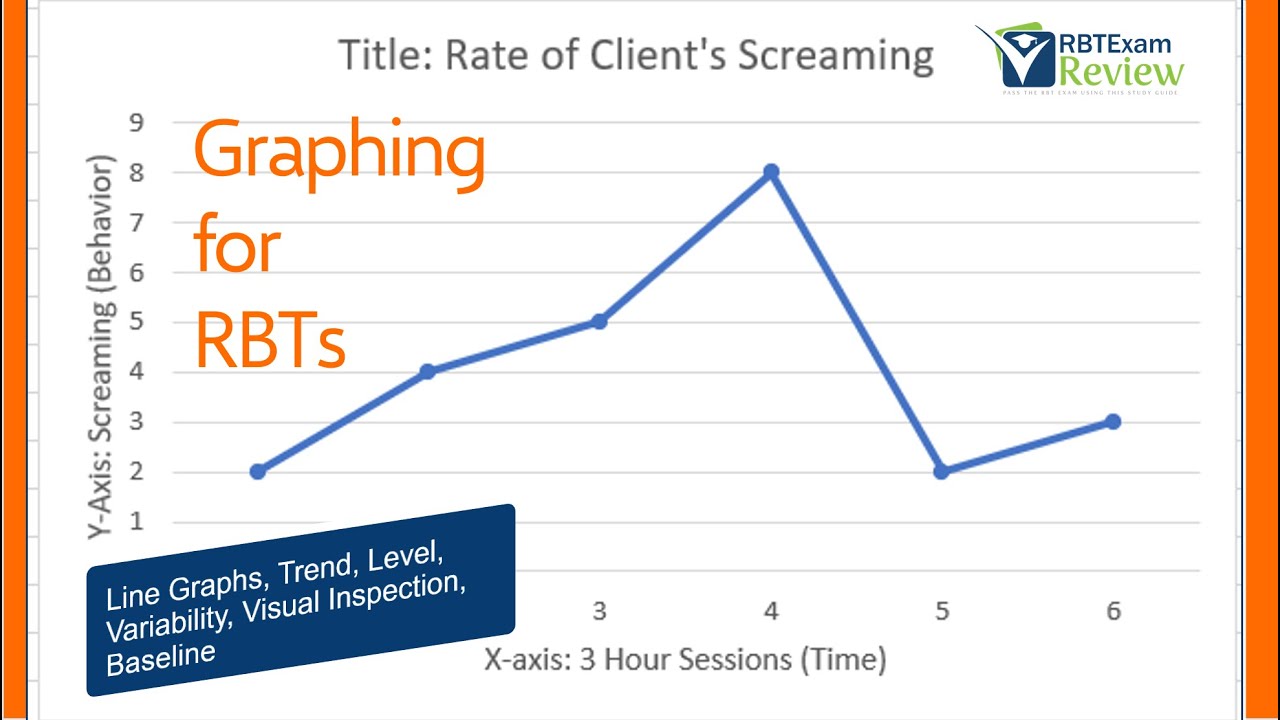
00:41 Components of a Line Graph (x-axis, y-axis, title, data point, data path, change line)
3:23 Reading a Line Graph: Trend (Increasing, Decreasing, No Trend)
5:15 Reading a Line Graph: Variability (High, Low)
7:55 Reading a Line Graph: Level (High, Moderate, Low)
9:17 Calculating Percentages
11:30 ABA Line Graph Questions
The most common ABA graph is the line graph. RBTs must know how to use visual analysis to interpret ABA line graphs. The RBT exam will ask questions about trend, variability, and level as well as the x-axis, y-axis, and baseline data. Line graphs represent a passage of time as well as the behavior or skill that you are targeting. RBTs may be responsible for graphing data and converting percentages using the line graph.
Thanks for the support!
Registered Behavior Technicians (RBT) implement applied behavior analysis (ABA) programming designed by BCBAs and BCaBAs. RBT Exam Review provides what you need to pass.
00:00 ABA Graphs for RBTs
00:20 RBT Exam Study Materials
00:41 Components of a Line Graph (x-axis, y-axis, title, data point, data path, change line)
3:23 Reading a Line Graph: Trend (Increasing, Decreasing, No Trend)
5:15 Reading a Line Graph: Variability (High, Low)
7:55 Reading a Line Graph: Level (High, Moderate, Low)
9:17 Calculating Percentages
11:30 ABA Line Graph Questions
The most common ABA graph is the line graph. RBTs must know how to use visual analysis to interpret ABA line graphs. The RBT exam will ask questions about trend, variability, and level as well as the x-axis, y-axis, and baseline data. Line graphs represent a passage of time as well as the behavior or skill that you are targeting. RBTs may be responsible for graphing data and converting percentages using the line graph.
Thanks for the support!
Registered Behavior Technicians (RBT) implement applied behavior analysis (ABA) programming designed by BCBAs and BCaBAs. RBT Exam Review provides what you need to pass.
Tags and Topics
Browse our collection to discover more content in these categories.
Video Information
Views
69.3K
Likes
1.5K
Duration
14:53
Published
Apr 11, 2021
User Reviews
4.7
(13) Related Trending Topics
LIVE TRENDSRelated trending topics. Click any trend to explore more videos.
Trending Now